Fraud Operations KPIs: Metrics, Targets, and Escalation Triggers
A scorecard for fraud and risk teams: 18 KPIs across loss exposure, detection, customer friction, operational efficiency, model quality, and chargeback spillover — with targets, cadence, and escalation logic.
Tracking only fraud loss rate and chargeback ratio gives a lagging view. A complete fraud operations scorecard covers six categories — Loss Exposure, Detection, Customer Friction, Operational Efficiency, Model Quality, and Chargeback Spillover — with cadence and escalation logic.
Most fraud teams measure two numbers: the fraud loss rate, because finance asks, and the chargeback ratio, because VAMP requires it. Both are lagging. A team can run an acceptable loss rate and a compliant chargeback ratio while detection controls are quietly decaying, false positives are eroding customer lifetime value, and model drift is accumulating weeks before it shows up in P&L.
The gap is an operational KPI tree — a set of metrics that tells you what your fraud function is doing, not just what the output already was. The six-category scorecard below covers the full operational picture: loss and exposure metrics, detection and prevention metrics, customer friction metrics, operational efficiency metrics, model and rule quality metrics, and chargeback spillover. It distinguishes between published thresholds enforced by card schemes and targets set by your team — which for most fraud KPIs means operator-set, because published standards in fraud operations are sparse.
One discipline applies throughout: segment by fraud type, not just in aggregate. Card-not-present fraud, account takeover, card testing, and first-party fraud have different detection economics, different false-positive profiles, and different chargeback outcomes. Blended metrics obscure all of them.
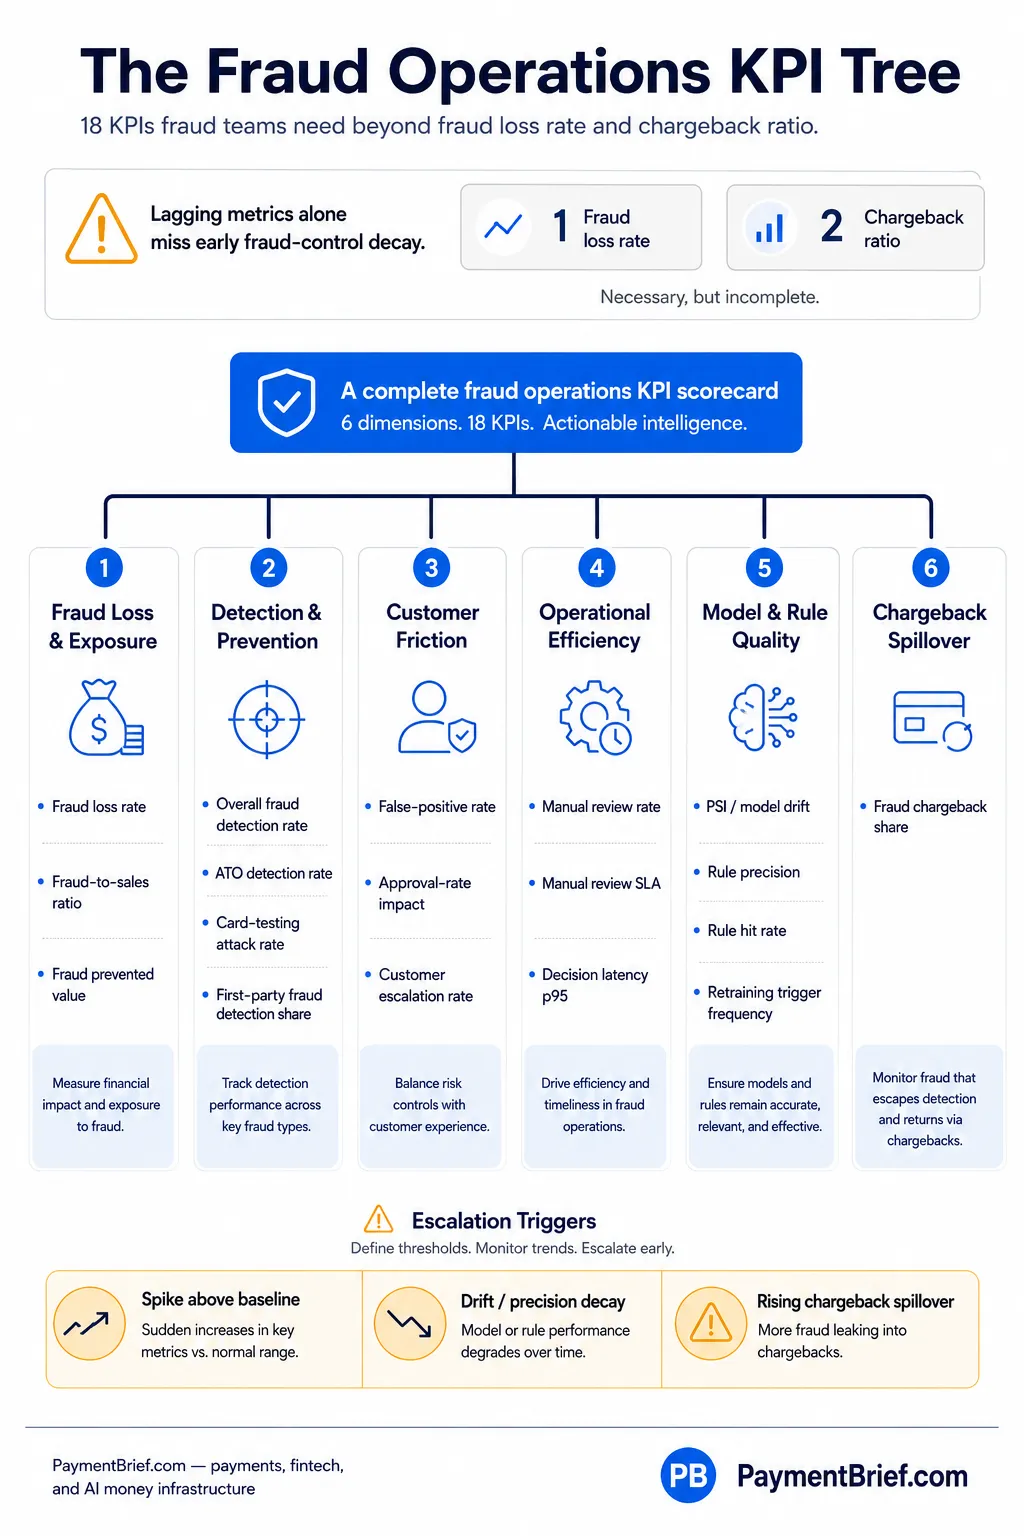
The fraud operations KPI scorecard — six categories from loss exposure to chargeback spillover.
The Short Answer
Six categories. A complete fraud operations scorecard covers:
- Loss & Exposure — fraud loss rate, fraud-to-sales ratio, fraud prevented value
- Detection & Prevention — overall fraud detection rate, ATO detection rate, card-testing attack rate, first-party fraud detection share
- Customer Friction — false-positive rate, approval-rate impact, customer escalation rate
- Operational Efficiency — manual review rate, manual review SLA, decision latency p95
- Model & Rule Quality — model performance decay (PSI), rule precision, rule hit rate, retraining/drift trigger frequency
- Chargeback Spillover — fraud chargeback share
Published benchmarks vs. operator targets. VAMP components (disputes, TC40, enumeration-flagged transactions) are scheme-enforced. PSI drift thresholds (>0.1 monitor, >0.25 major drift) are industry practice in financial services ML monitoring, not a payment-specific standard. For most fraud KPIs — detection rate, false-positive rate, decision latency, rule precision — no universal published benchmark exists. The right target is one that reflects your transaction mix, vertical risk profile, and tool stack.
The KPI Scorecard
| Metric | Calculation | Benchmark / source | Target guidance | Cadence | Escalation trigger |
|---|---|---|---|---|---|
| Fraud Loss & Exposure | |||||
| Fraud loss rate | Net fraud losses (after recoveries) ÷ gross payment volume × 10,000 — expressed in basis points | No universal published target. Scheme monitoring (VAMP, Mastercard ECP) sets compliance ceilings, not operating benchmarks. Operator-benchmarked via acquirer or PSP reporting where available. | Operator-set against own baseline; a rising trend over 3+ consecutive months warrants investigation regardless of absolute level | Weekly; monthly P&L review | >20% increase week-on-week; or sustained rising trend over 4 weeks |
| Fraud-to-sales ratio | Gross fraudulent transaction value (before recoveries) ÷ total payment volume × 100 | No universal published target. Tracks gross fraud exposure before recovery; distinct from net fraud loss rate. Visa CNP fraud thresholds feed into VAMP rather than being a direct merchant benchmark. | Operator-set; track alongside fraud loss rate — divergence between the two indicates a change in recovery effectiveness, not fraud control effectiveness | Monthly | Rising trend for 3+ consecutive months; or sudden spike (>50% above prior month) |
| Fraud prevented value | Estimated value of fraud blocked by controls confirmed as fraud — proxy via: rule precision × blocked volume × average order value | No published standard; inherently an estimate. Accuracy depends on rule precision (see Model & Rule Quality). Over-reliance on this metric without precision calibration inflates apparent prevention effectiveness. | Track trend alongside fraud loss rate; prevented value rising while loss rate falls indicates improving net effectiveness. Declining prevented value without rising loss rate may indicate attack volume is falling (not a prevention improvement). | Monthly | Sharp unexplained decline — may indicate rule degradation; investigate alongside rule precision |
| Detection & Prevention | |||||
| Overall fraud detection rate | Confirmed fraud intercepted ÷ (confirmed fraud intercepted + confirmed fraud that passed through) × 100 — denominator requires post-hoc labelling from chargebacks and TC40 | No published universal benchmark. Vendor-reported rates vary significantly by tool, vertical, and fraud type. The denominator problem (false negatives only become visible post-hoc) makes cross-operator comparison unreliable. | Set per fraud type — blended rates obscure type-specific performance. A rising detection rate with rising false positives indicates a precision trade-off, not pure improvement. | Monthly (requires chargeback cycle data for false negative confirmation) | Declining trend for 2+ consecutive months in any major fraud category |
| ATO detection rate | Confirmed ATO attempts intercepted ÷ total confirmed ATO attempts × 100 — requires post-hoc labelling from customer fraud reports and session data | No published standard. ATO is structurally distinct from payment fraud — it occurs at authentication, before payment. Blending ATO detection rate with CNP fraud detection rate produces a misleading composite. | Operator-set baseline per authentication layer. Track separately from CNP detection rate; ATO signals (credential stuffing, device anomalies, session hijack) require different controls. | Weekly (velocity and session anomaly monitoring); monthly (confirmed ATO rate) | Spike in account change events (password resets, email/phone updates) without corresponding customer-initiated activity; or confirmed ATO reports rising for 2+ consecutive weeks |
| Card-testing attack rate | Card-testing attempts (velocity-flagged low-value authorisation probes from a single IP, device, or BIN range) ÷ total authorisation attempts × 100 | No published standard. Visa VAMP includes enumeration-flagged transactions in the VAMP ratio calculation — card-testing detection failure contributes directly to VAMP exposure, not just fraud loss. | Operator-defined alert threshold based on baseline volume. Card-testing spikes are typically narrow in time window — track hourly during active attacks, not just monthly. | Real-time/daily during active monitoring; weekly trend | Attack volume exceeding 5× 7-day baseline for a 24-hour window; or VAMP enumeration component rising month-on-month |
| First-party fraud detection share | Transactions flagged as likely first-party fraud ÷ total fraud flags × 100 — requires labelling by fraud type, not just a binary fraud/not-fraud classification | No published standard. Vendor data suggests first-party fraud accounts for 40–60%+ of e-commerce disputes by some estimates, though this varies significantly by vertical (operator estimate — see sources). | Track as a composition metric. First-party fraud requires different intervention logic (dispute prevention tools vs. real-time payment blocking). A rising share may indicate CNP-optimised tools are missing first-party signals. | Monthly | Rising share with no corresponding change in dispute type distribution from chargeback operations — indicates detection classification may have shifted |
| Customer Friction | |||||
| False-positive rate | Legitimate transactions blocked or incorrectly flagged by fraud controls ÷ total transactions reviewed by fraud controls × 100 | No published universal standard. False declines carry a customer lifetime value cost that does not appear in fraud loss metrics. Vendor studies suggest false decline costs can exceed actual fraud losses in some CNP channels — treat any published figure as directional given methodology variation. | Operator-set; a common internal target for stable rule sets is <1% on transactions routed to fraud review. Monitor after every rule change — false positive spikes typically appear within 24–72 hours of a rule deployment. | Daily after rule changes; weekly otherwise | >2× baseline false-positive rate after a rule change; or customer complaint spike correlated with a rule deployment |
| Approval-rate impact | Delta between overall approval rate and approval rate on transactions that pass fraud controls — isolates the approval rate reduction attributable to fraud rule blocks vs. issuer decline codes | No published standard; context-dependent. Approval rate reduction has a direct revenue impact — a rule that reduces fraud loss rate by 5 bps but reduces approval rate by 2pp may have a negative net revenue impact at high average order values. | Operator-set dual metric: track fraud loss rate reduction against approval rate reduction as a pair. Neither metric alone captures the trade-off. Assess per rule change, not only in aggregate. | Weekly | >1pp approval rate decline from fraud rule changes in a single week without corresponding fraud reduction |
| Customer escalation rate | Customer contacts disputing a fraud-related block (declined transaction, locked account, blocked card) ÷ total fraud-flagged transactions × 100 | No published standard. A proxy for false-positive severity that carries a customer service cost and a customer lifetime value cost not captured in formal false-positive metrics. | Operator-set; a declining trend indicates improving decisioning accuracy. A rising trend after a rule change is an early indicator of a false-positive problem that may not yet appear in formal metrics. | Weekly | Rising trend for 2+ consecutive weeks; or a spike following a rule deployment |
| Operational Efficiency | |||||
| Manual review rate | Transactions routed to manual analyst review ÷ total transactions processed × 100 | No published standard; depends on transaction mix, vertical, tooling, and team size. A rising manual review rate with stable total volume is an early signal of model degradation or rule calibration drift — before it appears in fraud loss numbers. | Operator-set based on team capacity and cost tolerance. Track as a share of volume, not absolute count. Rising rate without rising fraud rate indicates the model is routing more legitimate transactions to review. | Daily | Rising manual review rate without corresponding increase in fraud detected in review — indicates rule or model degradation |
| Manual review SLA | % of manual review cases resolved within the defined SLA window (e.g., <2 hours for high-value, <24 hours for standard) — track by priority tier | No published standard. SLA should reflect transaction type and customer experience requirements — real-time payment holds have a much shorter acceptable window than batch review queues. | Operator-set SLA; a common internal standard is >95% compliance on the defined window. Below 90% compliance on any priority tier indicates a capacity or queue routing problem. | Daily | SLA compliance below 90% for any priority tier; or queue backlog rising without volume increase to explain it |
| Decision latency p95 | 95th percentile latency of the fraud decisioning system — time from transaction submission to accept/decline signal, in milliseconds | Card scheme authorisation timeout thresholds set the outer bound — confirm specific values with your acquirer or PSP. Industry practice for real-time CNP fraud scoring inline in the authorisation path is <100ms at p95 (operator estimate — see sources). | Operator-set; typically <100ms p95 for real-time scoring in the authorisation path. Latency above the authorisation timeout causes declines that are not fraud-driven — measure separately from fraud decision latency. | Real-time monitoring; daily/weekly review | p95 exceeding 200ms in the authorisation path; any timeout-related authorisation failures attributable to fraud system latency |
| Model & Rule Quality | |||||
| Model performance decay / PSI | Population Stability Index (PSI) on model input features: PSI = Σ (Actual% − Expected%) × ln(Actual% / Expected%) across feature buckets; also tracked via AUC/Gini on rolling holdout validation | PSI thresholds from financial services ML practice: PSI <0.1 = no significant drift; PSI 0.1–0.25 = minor drift, increase monitoring; PSI >0.25 = major drift, investigate and consider retraining. Not a payment-specific published standard. | Trigger investigation at PSI >0.1 on primary features; trigger retraining evaluation at PSI >0.25 or AUC decline >2 points on rolling 90-day holdout | Monthly (PSI); daily/real-time for critical features where tooling supports it | PSI >0.25 on any primary feature; or AUC decline >2 points over rolling 90-day window |
| Rule precision | Confirmed fraud flagged by rule ÷ total transactions flagged by rule × 100 — measured post-hoc using confirmed fraud labels from chargebacks, TC40, and manual review outcomes | No published standard. A rule with <10% precision is flagging nine legitimate transactions for every confirmed fraud it catches — the false-positive cost accumulates accordingly. | Operator-set per rule; a common threshold is >30–50% precision for high-friction rules (block or step-up). Low-friction rules (flag for review) can tolerate lower precision. Track per rule, not in aggregate. | Monthly (requires confirmed fraud labels); weekly for recently deployed rules | <10% precision on a rule applying to >0.5% of transaction volume; or declining trend over 2+ months |
| Rule hit rate | Transactions triggered by rule ÷ total transactions × 100 — track trend over time for each rule | No published standard. A rising hit rate on a static rule without corresponding fraud increase is a decay signal — the rule is now triggering on a broader population that includes more legitimate traffic. | Track trend alongside rule precision; a rising hit rate with falling precision is the canonical decay pattern and should trigger a rule specificity review before loss metrics deteriorate. | Weekly | Hit rate rising >20% month-on-month without corresponding fraud increase; or precision falling while hit rate rises |
| Retraining / drift trigger frequency | Number of model retraining events or significant rule review events triggered per quarter — distinguish planned (PSI-scheduled) from unplanned (emergency fraud spike response) | No published standard; an operational hygiene metric. Excessive retraining (>4× per quarter) may indicate model instability or insufficient training data. Too infrequent retraining (<1× per 6 months in an active fraud environment) may indicate insufficient model monitoring. | Operator-defined trigger cadence based on PSI monitoring and rule precision trends. Track ratio of planned to unplanned triggers — high unplanned frequency indicates reactive rather than proactive model governance. | Track per quarter; review each trigger event | Retraining triggered outside planned cycle by an emergency drift event; or rule review triggered by a fraud spike rather than proactive PSI/precision monitoring |
| Chargeback Spillover | |||||
| Fraud chargeback share | Chargebacks with fraud-category reason codes ÷ total chargebacks × 100 — mapped to Visa reason codes 10.x (CNP fraud) and 11.x (card-present fraud) and Mastercard fraud categories | No published target. Feeds directly into VAMP ratio components via TC40 and dispute inputs. Rising fraud chargeback share is a downstream signal of upstream detection gaps — fraud passed through controls and resulted in dispute costs. | Track trend; cross-reference with overall fraud detection rate. A rising fraud chargeback share with stable detection rates suggests fraud type composition has shifted — new attack patterns passing detection. Reconcile monthly against chargeback operations scorecard. | Monthly; reconcile with chargeback operations scorecard | Rising share for 2+ consecutive months; or VAMP ratio approaching 0.75% internal threshold alongside a rising fraud chargeback share |
Fraud Loss & Exposure KPIs in Depth
Fraud loss rate vs. fraud-to-sales ratio
The two metrics are frequently conflated but measure different things. Fraud loss rate (net losses in basis points) is a P&L metric — it captures what the operator actually absorbs after all recoveries: chargebacks won through representment, issuer-absorbed TC40 fraud, and any fraud-related write-offs. It is the number finance and senior management care about.
Fraud-to-sales ratio (gross fraud as a percentage of sales) is an exposure metric — it captures the volume of fraudulent transactions processed before any recovery mechanism applies. It is the number fraud operations and risk teams care about because it indicates attack surface and detection urgency.
The diagnostic value is in tracking both together. A falling fraud-to-sales ratio with a rising fraud loss rate means the attack surface is narrowing but recovery is failing — investigate chargeback representment effectiveness, refund policy exploitation, or issuer TC40 behaviour. A rising fraud-to-sales ratio with stable fraud loss rate means attack volume is growing but recovery is keeping pace — this is a capacity and detection signal even if P&L looks acceptable.
Fraud prevented value: measurement challenges
Fraud prevented value is useful as a directional efficiency metric but carries a measurement limitation: you cannot directly confirm whether a blocked transaction was fraudulent or legitimate. The standard proxy — rule precision × blocked transaction volume × average order value — is only as accurate as the precision measurement. A rule with 20% precision that blocks 10,000 transactions per month is credited with preventing 2,000 fraudulent transactions; the other 8,000 are false positives that this metric does not penalise.
Use fraud prevented value alongside false-positive rate, not instead of it. A rising prevented value with a rising false-positive rate is not a net positive.
Detection & Prevention KPIs in Depth
Overall fraud detection rate: the denominator problem
The fraud detection rate has a structural measurement challenge: false negatives (fraud that passed through undetected) only become visible after the fact, typically when a chargeback is filed or a TC40 report is received from the issuer. This means the denominator — total confirmed fraud attempts — is always incomplete and always lagging. Operators who measure fraud detection rate against only detected fraud are measuring precision, not recall.
The practical approach: calculate detection rate monthly using the prior month’s confirmed fraud data, including chargebacks received and TC40 reports. This creates a 30–60 day lag, which is why detection rate is a monthly metric rather than a real-time one. For a real-time proxy, use the precision of fraud blocks as the leading indicator.
For the broader AI and ML detection stack, see AI Fraud Detection in 2026: What the Models Are Actually Doing.
ATO as a distinct detection domain
Account takeover detection operates at a fundamentally different point in the customer journey than payment fraud detection. ATO typically occurs at authentication — login, credential change, session initiation — before any payment is attempted. A fraud system that only evaluates payment transactions will miss ATO entirely; by the time the compromised account makes a fraudulent payment, the account access signal has already passed.
ATO detection signals — device fingerprint anomalies, credential stuffing velocity, unusual session geography, account change event patterns — require monitoring at the authentication layer, not the payment authorisation layer. Track ATO detection rate as a separate metric from CNP fraud detection rate and wire the two together only at the chargeback spillover level. For the full ATO detection architecture, see Account Takeover Detection: The ML Stack Behind ATO Prevention.
Card testing and VAMP exposure
Card testing is typically treated as a fraud operations problem, but it has a direct VAMP compliance dimension: Visa includes enumeration-flagged transactions in the VAMP ratio calculation alongside disputes and TC40 reports. A merchant with a low chargeback ratio can still breach VAMP if card-testing enumeration exposure is elevated. Card-testing attack rate is therefore both a fraud operations metric and a compliance metric.
Detection relies on authorisation velocity rules, BIN range clustering, and enumeration pattern recognition. Card-testing attacks tend to be time-compressed — attack volume can spike by an order of magnitude within hours and drop when the attacker moves on. Daily or real-time monitoring is required; a monthly aggregated metric will miss the attack window entirely. For the full attack anatomy and operator defence playbook, see Card Testing and Enumeration Attacks: How to Detect and Stop Them.
First-party fraud detection
Friendly fraud — first-party fraud where the cardholder disputes a legitimate transaction — requires detection logic that is fundamentally different from CNP fraud. Real-time blocking is usually not appropriate (the customer authenticated and authorised the transaction). The intervention is post-transaction: dispute prevention tools, Ethoca and Verifi alerts, and customer-level risk scoring for repeat disputers.
Tracking first-party fraud detection share as a fraction of total fraud flags is useful as a composition signal. If the fraud tooling is optimised for CNP fraud and first-party fraud represents a growing share of losses, the total fraud detection rate can look stable while the actual problem area is underserviced. For the full first-party fraud framework, see First-Party Fraud and Friendly Fraud: Why the Lines Are Blurring.
Customer Friction KPIs in Depth
False-positive rate: the measurement problem
False-positive rate has a measurement challenge analogous to the false-negative problem in detection rate: you cannot directly observe the outcome of a blocked transaction. Three proxy methods are commonly used, each with different accuracy and cost profiles.
Customer escalation rate is the most accessible: customers who contact support because a legitimate transaction was blocked or an account was incorrectly locked. This understates false positives because many affected customers do not escalate — they simply abandon the transaction. It is a floor, not a ceiling.
Manual review sampling routes a random sample of fraud-blocked transactions through manual review to determine what fraction were incorrectly flagged. More accurate but requires analyst time and statistically meaningful sample sizes.
Holdout testing deliberately allows a fraction of flagged transactions through to observe the actual fraud outcome. This is the most rigorous method but involves intentional short-term fraud exposure that requires explicit business approval and careful design. It is the most accurate measure of the true false-positive rate and is worth the operational overhead for high-friction rules with significant approval rate impact.
Use at least one of these methods consistently — changing methods between measurement periods makes trend tracking meaningless.
Approval-rate impact as a dual metric
The approval rate impact from fraud controls is not inherently a negative — some fraud rate reduction requires some approval rate reduction. The operational goal is understanding the trade-off precisely, not minimising fraud controls.
The framing that makes this tractable: track fraud loss rate reduction and approval rate reduction as a pair for every significant rule change. A rule that reduces fraud loss rate by 10 bps while reducing approval rate by 0.1pp is a very different decision from one that reduces fraud loss rate by 5 bps while reducing approval rate by 2pp. Neither is automatically wrong, but both need to be assessed in the context of your average order value and customer lifetime value. Approval rate impact that flows through to revenue needs to be visible to the same finance stakeholders who see fraud loss rate.
Customer escalations as an early indicator
Customer escalation rate from fraud-related blocks tends to move before formal false-positive metrics catch up. A fraud rule deployed on a Monday may produce a customer escalation spike by Wednesday, before the manual review sample has been completed and before the monthly false-positive rate calculation captures the change. Wire customer escalation tracking to fraud rule deployments directly — a spike in “payment declined in error” or “account locked incorrectly” support contacts within 48 hours of a rule change is a strong signal to investigate before the full false-positive measurement cycle completes.
Operational Efficiency KPIs in Depth
Manual review rate as a model health signal
Manual review rate is more useful as a model health signal than as a direct efficiency metric. A rising manual review rate with stable fraud attack volume — measured in total authorisation attempts — indicates that the model or rules are routing an increasing share of transactions into the ambiguous middle band that requires human judgment. This is an early warning of model drift or rule decay, typically appearing weeks before it registers in fraud loss rate.
Track the trend per week, not only the absolute rate. A jump from 0.8% to 1.2% of total volume routed to manual review, with no corresponding change in confirmed fraud outcomes from that review, is the pattern to watch.
Decision latency in the authorisation path
For fraud systems operating inline in the payment authorisation path, latency is not just a performance metric — it is a functional constraint. Card scheme authorisation timeouts (the window within which an authorisation response must be returned) are set by scheme rules and acquirer configuration, but they are not the right operating target. Fraud system latency should be measured at p95 and the target should be well within the scheme timeout to preserve buffer for network latency, PSP processing, and upstream infrastructure variability.
Industry practice places real-time CNP fraud scoring in the authorisation path at under 100ms at p95. This is achievable with feature-store architectures that pre-compute high-latency features and serve them in-memory at decision time. For the full architecture behind sub-100ms fraud decisioning, see Real-Time Fraud Decisioning: How Payment AI Makes Sub-100ms Calls.
Decision latency above 200ms p95 in the authorisation path creates risk that the fraud system becomes a timeout driver — transactions declining not because they were flagged as fraud but because the response was slow. These are operationally distinct failure modes and should be measured separately.
Model & Rule Quality KPIs in Depth
PSI and model drift
Population Stability Index (PSI) measures whether the distribution of model input features has shifted relative to when the model was trained. It does not directly measure model accuracy — it measures whether the environment the model is operating in still matches the environment it was built for. The threshold values (investigate at PSI >0.1, major action at PSI >0.25) reflect industry practice in financial services ML model governance. They are not payment-specific published standards; they originate from credit scoring model monitoring practice and have been adopted broadly.
PSI should be calculated on primary model features monthly at minimum, and on the model score distribution itself (not just inputs) as an aggregate signal. A PSI spike on the score distribution without corresponding feature-level PSI change may indicate a shift in fraud patterns that the model’s features are not capturing rather than a change in the feature populations.
For the full MLOps framework — drift detection, retraining cadence, label lag, and production monitoring — see Payment AI MLOps: Model Drift, Retraining, and Production Monitoring. For context on when rule engines and ML models are most affected by drift, see Why You Still Need Rule Engines in 2026.
Rule precision and hit rate: the decay pattern
The canonical rule decay pattern is: hit rate rising, precision falling, over 2–3 months. What is happening operationally: a rule was written to identify a fraud pattern. The fraud pattern evolves or the fraudsters adapt. Legitimate transactions now share characteristics with the original fraud pattern, so the rule fires on them too. Hit rate rises (more transactions triggered), precision falls (smaller fraction of triggered transactions are actual fraud), and false-positive rate rises accordingly.
Detecting this early requires tracking both metrics per rule, per month. Detecting it before it shows in customer escalations or false-positive rate requires weekly monitoring for rules with high volume or high friction. A rule review triggered by a rising hit rate / falling precision pattern costs an analyst a few hours. A rule review triggered by a fraud spike or a customer service escalation surge costs significantly more.
Retraining cadence and governance
Retraining trigger frequency is an operations discipline metric — it captures whether model governance is proactive (PSI-triggered) or reactive (fraud-spike-triggered). A high ratio of unplanned to planned retraining events indicates the monitoring cadence is insufficient for the rate of fraud pattern change in the environment.
In high-attack environments — high-value CNP e-commerce, crypto exchanges, digital goods merchants — fraud patterns can shift in days during active campaigns. Monthly PSI monitoring is a minimum; operators in these environments often run weekly or continuous PSI on primary features and retrain on a rolling cycle. The operational overhead of frequent retraining is real but quantifiable. The cost of operating a decayed model for 6–8 weeks because monitoring was insufficient is typically much higher.
Chargeback Spillover in Depth
Fraud chargeback share is the metric that connects the fraud operations scorecard to the chargeback operations scorecard. Fraud that passes through detection controls eventually appears as a chargeback with a fraud-category reason code — Visa 10.x (CNP fraud), Visa 11.x (card-present fraud), and Mastercard’s equivalent fraud dispute categories. This is the financial materialisation of the upstream false-negative problem.
Three patterns are diagnostically useful. Rising fraud chargeback share with rising detection rate indicates the fraud type composition has shifted — new attack patterns are both being detected more (new rules or models) and passing through more (attack volume overwhelming controls). Rising fraud chargeback share with stable detection rate indicates a new fraud type has emerged that current controls do not address. Rising fraud chargeback share with falling detection rate is the most urgent pattern — controls are degrading and the degradation is showing up in dispute costs.
Reconcile fraud chargeback share monthly against the chargeback operations scorecard’s dispute type distribution. A widening gap between fraud detected operationally and fraud-category chargebacks may indicate issuer TC40 behaviour — issuers absorbing losses rather than filing disputes — which improves the VAMP dispute component but represents underlying fraud that has still passed through controls.
For the full chargeback operations KPI framework — compliance thresholds, operational cadence, representment rate, win rate, and cost metrics — see Chargeback Operations KPIs: Metrics, Targets, and Escalation Triggers. For VAMP programme mechanics and how fraud chargeback share feeds into scheme monitoring, see VAMP: Visa Acquirer Monitoring That Replaced VDMP and VFMP.
Reporting Cadence
Not all fraud KPIs warrant the same reporting frequency. A practical cadence:
Real-time and daily monitoring (fraud operations team): Decision latency p95 (continuous), card-testing attack rate (real-time alert tier plus daily review), manual review queue depth, SLA compliance. The purpose of daily monitoring is catching attacks and queue problems early, not producing metrics.
Weekly review (fraud team lead): False-positive rate trend (especially post-rule-change), approval-rate impact, customer escalation rate, manual review rate trend, rule hit rate per recently deployed rule, ATO velocity signals. The weekly review should compare current week to the prior 4-week average to distinguish spikes from trends.
Monthly report (fraud operations and finance): All loss and exposure KPIs (fraud loss rate, fraud-to-sales ratio), overall fraud detection rate (requires prior month’s chargeback/TC40 data), first-party fraud detection share, rule precision per rule, PSI per primary feature, retraining events in the month, fraud chargeback share. This is the primary management report — it connects fraud operations performance to P&L and scheme compliance.
Quarterly review (risk leadership and senior management): Trend lines across all categories, year-on-year comparison, model governance summary (PSI trend, retraining events, rule changes), customer friction summary (false-positive and escalation trends), fraud-to-chargeback reconciliation, and any structural changes in fraud type composition. This is the level at which model investment, tooling changes, and team resourcing are authorised.
Escalation Logic
Escalation triggers should be defined in writing before they are needed, with named owners at each tier.
Fraud analyst to fraud team lead: Manual review SLA below 90% compliance for any priority tier. Card-testing attack volume exceeding 5× 7-day baseline for a sustained window. Customer escalation rate spike within 48 hours of a rule deployment. Any rule with hit rate rising >20% month-on-month.
Fraud team lead to risk/operations leadership: Fraud loss rate rising >20% week-on-week for two consecutive weeks. Overall fraud detection rate declining for two consecutive months. PSI exceeding 0.25 on any primary model feature. Rule precision falling below 10% on any rule with >0.5% volume coverage. False-positive rate exceeding 2× baseline following a rule change. Fraud chargeback share rising for two consecutive months.
Risk/operations leadership to senior management: Fraud loss rate establishing a rising trend over three consecutive months. VAMP ratio approaching the 0.75% internal ceiling — particularly when driven by rising fraud chargeback share or enumeration exposure. Any emergency model retraining triggered by a fraud spike rather than proactive monitoring (indicates monitoring was insufficient). Approval-rate impact from fraud controls becoming material to revenue planning assumptions.
Zero-escalation principle: A card-testing attack that breaches VAMP enumeration thresholds should trigger an immediate post-mortem on whether detection controls were adequate, regardless of financial impact. Scheme programme entry from enumeration has compliance and acquirer relationship consequences that are disproportionate to the direct fraud cost.
Common Measurement Pitfalls
Measuring fraud detection rate with only detected fraud in the denominator. The detection rate denominator requires confirmed fraud that passed through undetected (false negatives) — not just confirmed fraud that was caught. Using only caught fraud produces a metric that measures precision, not recall. Build the denominator from prior-period chargeback data and TC40 reports.
Treating fraud prevented value as a standalone success metric. Fraud prevented value is only meaningful when tracked alongside rule precision and false-positive rate. A rule with low precision can produce a high prevented-value figure by blocking a large volume of legitimate transactions and miscounting them as prevented fraud.
Blending ATO detection rate with CNP fraud detection rate. ATO detection and CNP fraud detection require different controls, different signals, and operate at different points in the customer journey. Blending them into a single detection rate produces a number that is accurate for neither.
Measuring false-positive rate only monthly. False-positive spikes from rule changes appear in 24–72 hours. Monthly measurement means a rule deployed on the first of the month could be generating customer friction for 30 days before the false-positive metric registers it. Wire customer escalation tracking to rule deployments as a real-time proxy.
Treating card-testing attack rate as a pure fraud operations metric. Card-testing failure contributes to VAMP enumeration exposure. Operators who treat card testing as only a fraud problem and not a scheme compliance problem may be underestimating their VAMP exposure.
Optimising decision latency at median rather than p95. Median latency can look acceptable while a long p95 tail creates authorisation timeout risk for a meaningful fraction of transactions. Monitor and set targets at p95, not p50.
Skipping per-rule PSI and precision tracking and relying only on aggregate model performance. Aggregate model AUC can be stable while individual rules or model segments are decaying significantly. Monitor model components and individual rules separately from aggregate performance.
Conflating retraining frequency with model quality. Frequent retraining is a signal that either monitoring is strong (proactive) or the environment is highly volatile (reactive). Low retraining frequency is only a sign of stability if it is accompanied by stable PSI and precision — otherwise it indicates insufficient model monitoring.
What to Read Next
The fraud detection stack — what these KPIs are measuring:
AI Fraud Detection in 2026: What the Models Are Actually Doing → Real-Time Fraud Decisioning: How Payment AI Makes Sub-100ms Calls → Why You Still Need Rule Engines in 2026 → Account Takeover Detection: The ML Stack Behind ATO Prevention
Fraud types that drive the detection and spillover categories:
First-Party Fraud and Friendly Fraud: Why the Lines Are Blurring
The chargeback operations scorecard this connects to:
Chargeback Operations KPIs: Metrics, Targets, and Escalation Triggers · VAMP: Visa Acquirer Monitoring That Replaced VDMP and VFMP
Sources
VAMP enumeration-flagged transactions included in VAMP ratio
Enumeration-flagged transactions (card testing detected at the Visa network level) are a component of the VAMP ratio calculation alongside disputes and TC40 fraud reports
Checked:
PSI thresholds for model drift monitoring
PSI <0.1 no action; PSI 0.1–0.25 monitor; PSI >0.25 investigate and consider retraining
PSI thresholds are widely used in financial services model monitoring. They are not a payment-specific published standard; they reflect credit scoring model governance practice adopted broadly in financial ML.
Checked:
Real-time fraud scoring latency target in authorization path
<100ms at p95
Sub-100ms p95 latency target for real-time fraud scoring is industry practice; actual authorization timeout thresholds vary by scheme and PSP
Checked:
First-party fraud share of e-commerce disputes — vendor data estimate
Vendor data suggests first-party fraud accounts for 40–60%+ of e-commerce disputes depending on vertical; figures vary widely by merchant category and tool methodology
Checked:
VAMP standard and excessive monitoring thresholds
0.9% standard; 1.8% excessive
As established in PaymentBrief VAMP article; verify current thresholds with acquirer as Visa rules are subject to update
Checked:
Source types explained in our Methodology.
Subscribers get the PSP Selection RFP Kit — 60+ structured questions, evaluation scorecard, and negotiation playbook — delivered to your inbox instantly.