Chargeback Operations KPIs: Metrics, Targets, and Escalation Triggers
A scorecard for dispute and risk teams: 16 KPIs across compliance, operational, outcome, quality, and cost — with targets, cadence, and escalation logic.
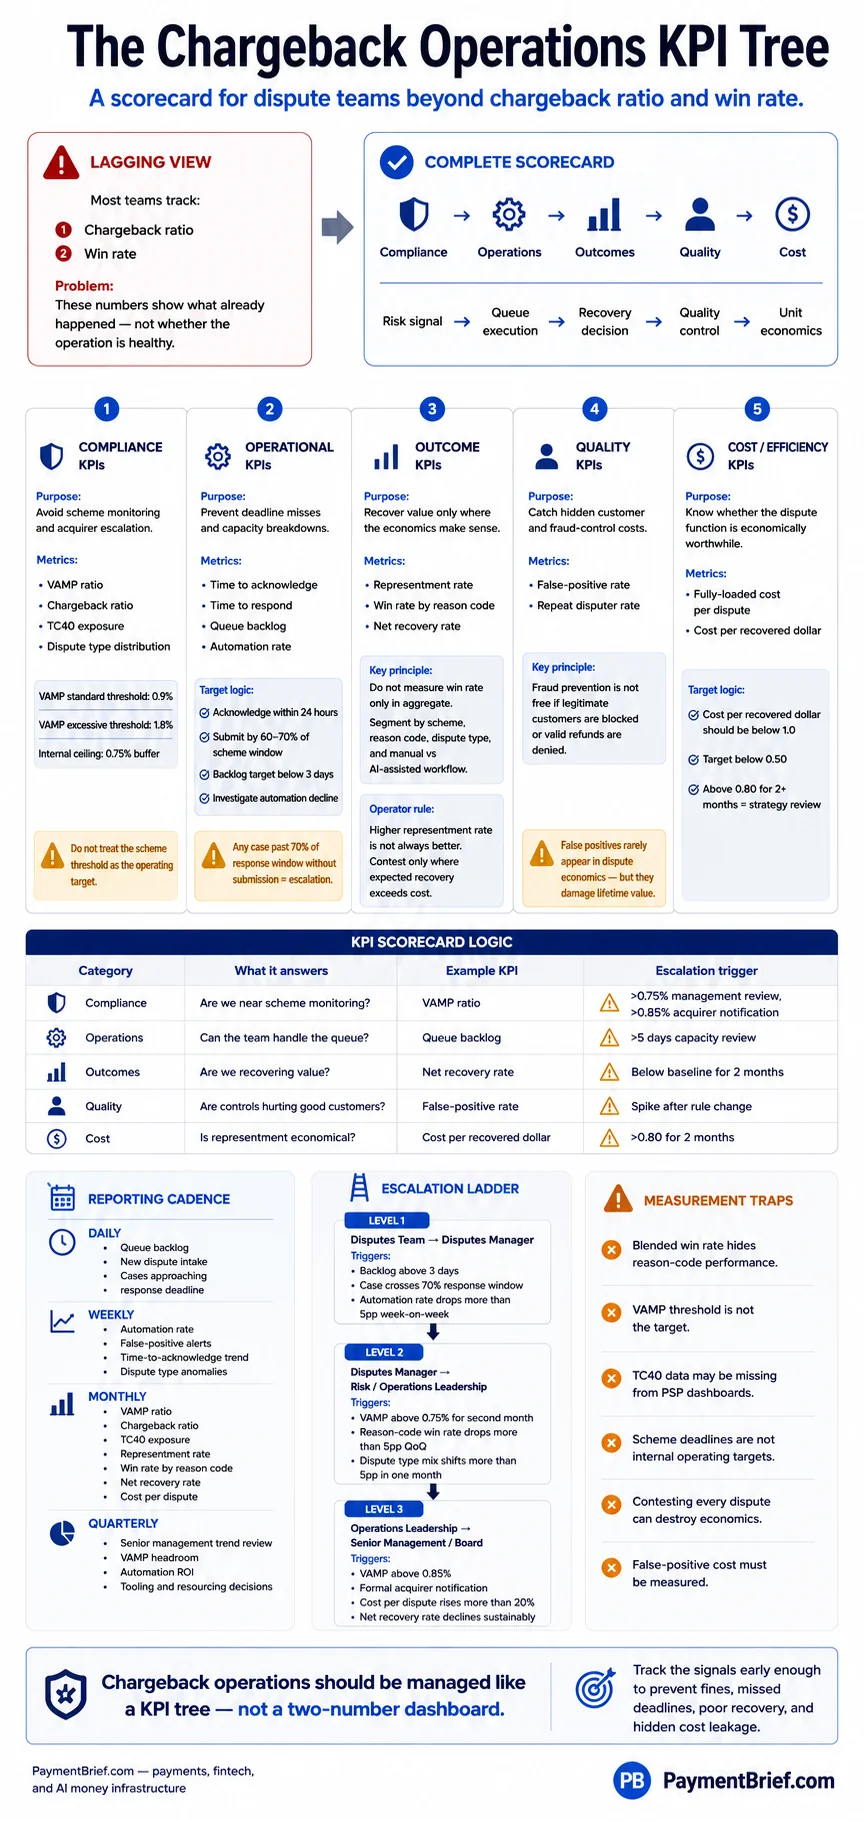
Tracking only the chargeback ratio and win rate gives a lagging view of a dispute operation. A complete scorecard covers five categories — Compliance, Operational, Outcome, Quality, and Cost — and distinguishes scheme-set thresholds from operator-set targets.
Most dispute teams measure two numbers: the chargeback ratio, because VAMP requires it, and the win rate, because finance asks. Both are lagging. A team can run a compliant VAMP ratio, a respectable win rate, and still be leaving recoverable revenue uncollected, absorbing preventable costs, and missing the early signals that a fraud wave or process failure is compounding.
The gap is an operational KPI tree — a set of metrics that tells you what your chargeback function is doing, not just what the output already was. The five-category scorecard below covers the full operational picture: scheme compliance metrics, team execution metrics, recovery outcome metrics, quality metrics, and cost metrics. It distinguishes between thresholds set by the card schemes (which are fixed and externally enforced) and targets set by your team (which are judgment calls about what good looks like for your business and dispute mix).
One discipline applies throughout: track by reason code, not just in aggregate. A blended win rate or a blended cost per dispute is almost always misleading. The signals that tell you where to act are visible only at the reason-code level.
The chargeback operations KPI scorecard — five categories from scheme compliance to cost per recovered dollar.
The Short Answer
Five categories. A complete chargeback operations scorecard covers:
- Compliance — VAMP ratio, chargeback ratio, TC40 exposure, dispute type distribution
- Operational — time to acknowledge, time to respond, queue backlog, automation rate, evidence coverage rate
- Outcome — representment rate, win rate by reason code, net recovery rate
- Quality — false-positive rate on prevention decisions, repeat disputer identification
- Cost/efficiency — fully-loaded cost per dispute, cost per recovered dollar
Scheme thresholds vs operator targets. VAMP thresholds — acquirer Above Standard ≥0.50% and Excessive ≥0.70%, and a merchant excessive threshold of ≥2.2% (≥1.5% from 1 April 2026) — are published by Visa and enforced through your acquirer; these are hard ceilings. Internal operational targets are operator-set. For most operational KPIs, no published industry standard exists; the right target is one that reflects your dispute mix, team size, and tolerance for false positives and false negatives.
The KPI Scorecard
| Metric | Calculation | Benchmark / source | Target guidance | Cadence | Escalation trigger |
|---|---|---|---|---|---|
| Compliance | |||||
| VAMP ratio | (TC40 fraud + TC15 disputes) ÷ settled tx (TC05) × 100; enumeration tracked separately | Acquirer ≥0.50% Above Standard, ≥0.70% Excessive; merchant excessive ≥2.2% (≥1.5% from 1 Apr 2026) — Visa VAMP | <0.50% internal ceiling — stay below the acquirer Above Standard threshold | Monthly | >0.40% → management review; approaching 0.50% → immediate acquirer notification |
| Chargeback ratio (count) | Chargebacks received ÷ total transactions × 100 | Feeds into VAMP dispute component; Visa and Mastercard publish separate programme thresholds | Set to maintain VAMP compliance buffer; typically <0.50% | Monthly | Rising trend for 2+ consecutive months |
| TC40 exposure | TC40 fraud reports received ÷ total transactions × 100 (requires acquirer data feed) | No separate published threshold; feeds directly into VAMP ratio | Monitor trend; no universal target. Alert on >10% month-on-month increase | Monthly | Upward trend — indicates issuer-absorbed fraud rising before it appears in chargebacks |
| Dispute type distribution | % of disputes by category (first-party fraud, true fraud, merchant error, unrecognised) | No published standard; vendor data suggests first-party fraud accounts for 40–60%+ of e-commerce disputes depending on vertical (operator estimate) | Track trend; a sudden shift of >5pp within one month typically indicates a new pattern | Monthly | >5pp shift in a single month → investigation |
| Operational | |||||
| Time to acknowledge | Time from dispute notification to case opened in queue | No published standard; scheme deadlines run from notification date | Operator-set; <24 hours is common practice — any later delays response planning | Daily | Any dispute unacknowledged >48 hours |
| Time to respond | Time from dispute notification to representment package submitted | Scheme deadlines vary by reason code and programme — confirm specific windows with your acquirer; do not assume a single universal deadline | Submit by 60–70% of scheme window maximum — leaves buffer for evidence gathering and review | Per-case; daily monitoring | Any case past 70% of scheme deadline window without submission |
| Queue backlog | Open cases ÷ (cases closed per day, rolling 7-day average) | No published standard | Operator-set based on team size and volume; a common internal target is <3 days of backlog | Daily | >5 days backlog → capacity review; sustained trend → hire or automate |
| Automation rate | Cases auto-resolved without manual review ÷ total cases × 100 | Vendor-reported; varies significantly by dispute type and tool. CE 3.0-qualifying friendly fraud disputes are the most automatable category | Operator-set based on dispute mix; track trend — a declining automation rate may indicate rule drift or evidence coverage gaps | Weekly | >10pp decline in automation rate month-on-month |
| Evidence coverage rate | Eligible disputes with required evidence available ÷ total eligible disputes × 100, segmented by reason code | No published universal benchmark — operator-set baseline | Track by reason code and dispute type; goal is rising coverage on high-volume, high-value, winnable reason codes rather than a universal percentage target | Weekly (active queues); monthly (management report) | >10pp month-on-month drop on a major reason code; or evidence unavailable before 50% of scheme response window |
| Outcome | |||||
| Representment rate | Disputes contested ÷ total disputes eligible to contest × 100 | Industry data indicates many merchants contest fewer than 20% of eligible disputes (operator estimate — varies by vertical and team maturity) | Not all disputes should be contested — only contest where expected recovery exceeds representment cost. Set target by reason code | Monthly | Significant drop without corresponding change in dispute mix or reason-code distribution |
| Win rate (by reason code) | Disputes won ÷ disputes contested × 100 — calculated per reason code, not in aggregate | Vendor-reported ranges vary widely by dispute type and evidence quality; friendly fraud with CE 3.0-compliant evidence achieves higher rates than true fraud disputes. No universal benchmark applies | Set per reason code based on historical baseline; a 5pp quarter-on-quarter decline in a stable reason code warrants investigation | Monthly | >5pp decline in a single reason code QoQ |
| Net recovery rate | Net recovered value (dispute value won minus representment costs) ÷ total disputed value × 100 | No published standard; depends on representment rate, win rate, and representment cost per case | Track trend against baseline; use as an efficiency composite that captures representment rate × win rate × cost together | Monthly | Below internal baseline for 2 consecutive months |
| Quality | |||||
| False-positive rate | Legitimate transactions blocked or legitimate refund requests incorrectly denied ÷ total flagged × 100 | No published standard; false positives carry a customer lifetime value cost that does not appear in dispute economics | Operator-set; typically <0.5% of flagged transactions on stable rule sets. Monitor spikes after any rule change | Weekly after rule changes; monthly otherwise | Spike in customer complaints correlated with a rule change; or upward trend over 4 weeks |
| Repeat disputer rate | Disputes from customers previously identified as first-party fraud ÷ total disputes × 100 | No published standard; varies significantly by vertical (subscriptions and digital goods tend higher) | Declining trend indicates prevention effectiveness; rising trend requires review of repeat-disputer block logic | Monthly | Upward trend for 2+ consecutive months |
| Cost / Efficiency | |||||
| Fully-loaded cost per dispute | (FTE time × blended labour rate) + scheme dispute fees + fraud-tool cost allocation + any dispute management platform cost) ÷ total disputes | No published standard; depends heavily on ticket size, vertical, team structure, and automation level | Set as a planning budget; track trend. Use the unit economics framework from the True Cost of Chargeback article as the cost component guide | Monthly | >20% increase without corresponding volume increase → investigate cost driver |
| Cost per recovered dollar | Total representment costs ÷ net value recovered | No published standard; must be <1.0 to be economical (spend less than you recover) | Target <0.50 to ensure representment remains worthwhile. Above 0.80, review whether contested cases are the right ones | Monthly | Trending above 0.80 for 2+ months → review representment strategy |
Compliance KPIs in Depth
VAMP ratio
The VAMP ratio replaced VDMP and VFMP in April 2025 as Visa's consolidated merchant monitoring metric. It is broader than the chargeback ratio because it adds TC40 issuer fraud reports (fraud the issuer absorbed without filing a chargeback) to disputes (TC15), over settled transactions; card testing/enumeration is tracked separately under Visa's enumeration ratio. A merchant with a low chargeback ratio can still build VAMP exposure if TC40 fraud is elevated. For the mechanics and enforcement framework, see VAMP: Visa Acquirer Monitoring That Replaced VDMP and VFMP.
Key operating principle: the merchant excessive threshold (≥2.2%, dropping to ≥1.5% in April 2026) is the scheme ceiling, but acquirers manage their own portfolios to the Above Standard (≥0.50%) and Excessive (≥0.70%) thresholds and pass that pressure down — so none of these should be the operating target. Set an internal ceiling below 0.50% to stay clear of the acquirer Above Standard threshold. VAMP monitoring itself creates remediation overhead and potential fees that make a ratio close to the threshold expensive even before it is technically breached. For the step-by-step remediation plan once monitoring has triggered, see VAMP Remediation Checklist: Steps to Exit Visa Acquirer Monitoring.
TC40 visibility gap
Most PSP dashboards do not surface TC40 data. Merchants who have not requested TC40 reporting from their acquirer are likely underestimating their effective VAMP exposure. Request monthly TC40 data from your acquirer explicitly. If your acquirer cannot provide it, that is a significant compliance visibility gap.
Mastercard programme thresholds
Mastercard operates separate ECP (Excessive Chargeback Programme) and HECM (High Excessive Chargeback Merchant) thresholds with different calculation methodologies than Visa's VAMP. For current Mastercard programme thresholds, deadlines, and dispute category codes, see the Mastercard Mastercom Dispute Categories Reference.
Operational KPIs in Depth
Time to respond is not one number
The most common error in managing the response-time KPI is treating scheme deadlines as a single universal number. They are not. Response windows vary by reason code, scheme programme, and in some cases by market. Visa VCR deadlines for consumer disputes differ by reason code group; Mastercard categories have their own specific windows. Confirm the exact deadlines for each reason code you regularly receive with your acquirer, and document them as your team's response-time contract.
Setting an internal submission target at 60–70% of the available scheme window ensures you have buffer for evidence retrieval, package preparation, and internal review. A scheme deadline missed because an analyst was waiting on a third-party evidence document is not recoverable — there is no appeal mechanism for a late representment.
Queue backlog as a capacity signal
Queue backlog (open cases divided by daily case closure rate) is the earliest leading indicator of a resourcing problem. A backlog of more than three days means cases are approaching submission windows more compressed than your team can comfortably manage. A backlog beyond five days is a structural problem, not a temporary spike — either volume has grown past team capacity or automation rate has declined.
Automation rate and evidence coverage
The automation rate captures what fraction of disputes are resolved without manual analyst intervention. It tends to be highest for friendly fraud disputes where structured delivery evidence, digital access logs, and geolocation data can be assembled programmatically. Compelling Evidence 3.0 (CE 3.0) qualification — Visa's framework for automatic dispute resolution using prior undisputed transactions — has expanded the automatable surface area for recurring subscription merchants since its 2024 launch. A declining automation rate in the absence of new dispute volume is typically explained by evidence coverage gaps or rule drift; investigate before it compounds.
Evidence coverage rate
Evidence coverage rate measures whether the team has the delivery logs, access logs, customer history, device data, refund history, or fulfilment evidence required to assemble a strong representment package. It is calculated as eligible disputes with required evidence available divided by total eligible disputes, segmented by reason code and dispute type.
It is a leading indicator for both automation rate and win rate — disputes without evidence cannot be automated and rarely win when contested manually. There is no published universal benchmark, so it is operator-set. The operational goal is not a single percentage but rising coverage on the reason codes that matter most: high-volume, high-value, and winnable codes where evidence is the binding constraint on recovery. Set targets per reason code; a coverage drop of more than 10 percentage points month-on-month for a major reason code, or evidence unavailable before 50% of the scheme response window, should trigger a root-cause review of the evidence pipeline — logging gaps, source-system access, retention policies, or fulfilment data flow.
Outcome KPIs in Depth
Representment rate: not higher is not always better
Representment rate (disputes contested divided by eligible disputes) is sometimes treated as a pure efficiency gain — contest more, recover more. The correct calculation is marginal. Representment costs time, labour, and occasionally platform fees. Contesting a dispute where the expected win probability is low and the dispute value is small has a negative expected return. The right representment rate is the rate at which expected recovery exceeds representment cost at the reason-code level, not the highest achievable rate across all disputes.
For the foundational mechanics of the representment process and evidence requirements, see Chargeback Representment: Why Merchants Lose Money They Could Recover.
Win rate: why blended is misleading
A blended win rate averages across dispute categories with fundamentally different win probability profiles. True fraud disputes — where the cardholder's card was used without their knowledge — have very different evidence requirements and win rates than first-party fraud disputes where the cardholder made the purchase and later claimed they did not. Bundling the two into a single win rate obscures both. Track win rate by Visa reason code (11.x for true fraud, 13.x for merchant error, the specific codes used for consumer disputes) and Mastercard category separately.
See the Visa Reason Codes Reference for the active code map with documented evidence requirements, and the Mastercard Mastercom Dispute Categories Reference for Mastercard equivalents — or the reason-code lookup tool for a per-code view while triaging the queue.
For what AI-assisted representment changes in the win-rate calculus, see AI Chargeback Representment Automation: What Actually Works in 2026.
Reporting Cadence
Not all KPIs warrant the same reporting frequency. A practical cadence:
Daily review (disputes operations team): Queue backlog, new dispute intake, any case approaching its response window. The goal of daily review is preventing deadline misses, not producing metrics.
Weekly review (disputes manager): Automation rate, false-positive alerts, time-to-acknowledge trend, any anomalies in dispute type distribution. Catch process problems before they become monthly numbers.
Monthly report (operations and finance): All compliance KPIs (VAMP ratio, chargeback ratio, TC40 exposure), all outcome KPIs (representment rate, win rate by reason code, net recovery rate), cost per dispute, cost per recovered dollar. This is the primary management report — it aligns dispute function performance with finance and risk leadership.
Quarterly summary (senior management): Trend lines across all categories, year-over-year comparison, VAMP headroom, win rate trajectory, automation ROI, and any structural changes in dispute mix. This is the level at which resourcing decisions, tool investment, and programme changes are typically authorised.
Escalation Logic
Escalation triggers should be defined in writing before they are needed, with named owners for each tier.
Disputes team to disputes manager: Queue backlog above three days. Any case crossing 70% of scheme response window without submission. Automation rate drop of more than five percentage points week-on-week.
Disputes manager to risk/operations leadership: VAMP ratio above 0.40% for the second consecutive month. Win rate in any major reason code category declining more than five percentage points quarter-on-quarter. Sudden shift of more than five percentage points in dispute type distribution within a single month. Any case where a scheme deadline is at risk of being missed.
Operations leadership to senior management / board: VAMP ratio approaching 0.50% — the acquirer Above Standard threshold. Any formal acquirer notification about VAMP monitoring status. Cost per dispute increasing more than 20% over a quarter without corresponding volume growth. A sustained decline in net recovery rate.
Zero-escalation principle: A scheme deadline miss — submitting a representment after the scheme window has closed — should trigger an immediate post-mortem regardless of the dispute value. The operational failure that produced a missed deadline is the signal that matters, not the lost revenue on the individual case.
Common Measurement Pitfalls
Measuring win rate in aggregate. Covered above — blended win rates hide reason-code-level performance. Segment by scheme and reason code before drawing any conclusion about whether representment is working.
Treating the VAMP threshold as the target. A VAMP ratio of 0.89% is not a success. It is one bad month from triggering formal monitoring with fine escalation from your acquirer. Set internal ceilings with buffer.
Missing TC40 in VAMP exposure. Most merchants do not have TC40 data visibility unless they explicitly request it from their acquirer. If you are tracking only the chargeback ratio, your VAMP exposure estimate is incomplete.
Confusing scheme deadlines with internal targets. The scheme deadline is the outer bound. It is not the operational target. Running a disputes process where responses are routinely submitted at 90%+ of the available window creates unnecessary deadline risk from evidence delays, system issues, or analyst capacity.
Ignoring the false-positive cost. The unit economics of chargeback prevention typically focus on the cost of disputes allowed through — the lost revenue and fees on fraud that was not stopped. The cost of false positives — legitimate customers blocked or legitimate refund requests denied — rarely appears in dispute metrics but accumulates as lost customer lifetime value. Measure both sides.
Contesting every dispute regardless of expected value. Representment has a cost. For low-value disputes with low win probability in the specific reason code, the expected return on representment is negative. A disciplined representment strategy routes only eligible, winnable cases to the contest queue. See the True Cost of a Chargeback for the unit economics framework.
Not segmenting win rates by whether the merchant contested manually or with AI assistance. If you have introduced AI representment tooling for some dispute types and manual review for others, blending win rates across the two tracks produces a number that accurately represents neither. Track separately and compare like-for-like.
What to Read Next
The chargeback series — the foundation this scorecard sits on:
Scheme rules, 2025–2026 changes, and CE 3.0 → True cost of a chargeback → First-party fraud and friendly fraud → How representment actually works → VAMP enforcement thresholds
Reference pages for reason code specifics:
Visa Reason Codes Reference · Mastercard Mastercom Dispute Categories Reference
For AI-assisted representment and automation rate context:
AI Chargeback Representment Automation: What Actually Works in 2026
To choose the dispute-management operating model and platform layer that these KPIs then measure, see Chargeback Management Compared: Alerts, Representment, and Recovery Models.
The full Chargeback Operator reading list — from scheme rules through unit economics, fraud categories, representment, VAMP enforcement, and this KPI scorecard — is at Chargeback Operator Reading List.
Sources & methodology (6)
VAMP acquirer-portfolio thresholds
Above Standard ≥0.50%; Excessive ≥0.70%
Verify current thresholds with your acquirer or Visa representative; Visa periodically revises VAMP
Checked:
VAMP merchant excessive threshold
≥2.2%, reducing to ≥1.5% from 1 April 2026 (AP/Canada/EU/U.S.)
VAMP ratio = fraud (TC40) + disputes (TC15) / settled transactions (TC05); pre-dispute- and CE 3.0-resolved items excluded contingent on timing
Checked:
VAMP minimum transaction volume for monitoring
1,000 transactions per month
Checked:
Merchant representment rate — industry observation
Industry data indicates many merchants contest fewer than 20% of eligible disputes; win rates for manually handled representment are often below 30–40%
Checked:
AI-assisted representment win rate range
Vendor-reported figures suggest AI-assisted win rates of 65–80% in qualifying dispute categories; these are vendor-published claims and will vary by tool, dispute type, and evidence quality
Checked:
Global chargeback burden estimate
$33.8B (2025)
Vendor-published estimate; methodologies vary across sources
Checked:
Source types explained in our Methodology.